Pipeline Metrics
The metrics features allows operators to track the progress and performance of long-running Oura sessions.
Context
Some use-cases require Oura to be running either continuosuly or for prolonged periods of time. Keeping a sink updated in real-time requires 24/7 operation. Dumping historical chain-data from origin might take several hours.
These scenarios require an understanding of the internal state of the pipeline to facilitate monitoring and troubleshooting of the system. In a data-processing pipeline such as this, two important aspects need to observable: progress and performance.
Feature
Oura provides an optional /metrics HTTP endpoint that uses Prometheus format to expose real-time opertional metrics of the pipeline. Each stage (source / sink) is responsible for notifying their progress as they process each event. This notifications are then aggregated via counters & gauges and exposed via HTTP using the well-known Prometheus encoding.
The following metrics are available:
chain_tip: the last detected tip of the chain (height)rollback_count: number of rollback events occurredsource_current_slot: last slot processed by the source of the pipelinesource_current_height: last height (block #) processed by the source of the pipelinesource_event_count: number of events processed by the source of the pipelinesink_current_slot: last slot processed by the sink of the pipelinesink_event_count: number of events processed by the sink of the pipeline
Configuration
The metrics feature is a configurable setting available when running in daemon mode. A top level [metrics] section of the daemon toml file controls the feature:
# daemon.toml file

[metrics]
address = "0.0.0.0:9186"
endpoint = "/metrics"
[metrics]section needs to be present to enable the feature. Absence of the section will not expose any HTTP endpoints.address: The address at which the HTTP server will be listening for request. Expected format is<ip>:<port>. Use the IP value0.0.0.0to allow connections on any of the available IP address of the network interface. Default value is0.0.0.0:9186.endpoint: The path at which the metrics will be exposed. Default value is/metrics.
Usage
Once enabled, a quick method to check the metrics output is to navigate to the HTTP endpoint using any common browser. A local instance of Oura with metrics enabled on port 9186 can be accessed by opening the URL http://localhost:9186
An output similar to the following should be shown by the browser:
# HELP chain_tip the last detected tip of the chain (height)
# TYPE chain_tip gauge
chain_tip 6935733
# HELP rollback_count number of rollback events occurred
# TYPE rollback_count counter
rollback_count 1
# HELP sink_current_slot last slot processed by the sink of the pipeline
# TYPE sink_current_slot gauge
sink_current_slot 2839340
# HELP sink_event_count number of events processed by the sink of the pipeline
# TYPE sink_event_count counter
sink_event_count 2277714
# HELP source_current_height last height (block #) processed by the source of the pipeline
# TYPE source_current_height gauge
source_current_height 2837810
# HELP source_current_slot last slot processed by the source of the pipeline
# TYPE source_current_slot gauge
source_current_slot 2839340
# HELP source_event_count number of events processed by the source of the pipeline
# TYPE source_event_count counter
source_event_count 2277715
Regardless of the above mechanism, the inteded approach for tracking Oura's metrics is to use a monitoring infrastructure compatible with Prometheus format. Setting up and managing the monitoring stack is outside the scope of Oura. If you don't have any infrastructure in place, we recommend checking out some of the more commons stacks:
- Prometheus Server + Grafana
- Metricbeat + Elasticsearch + Kibana
- Telegraf + InfluxDB + Chronograf
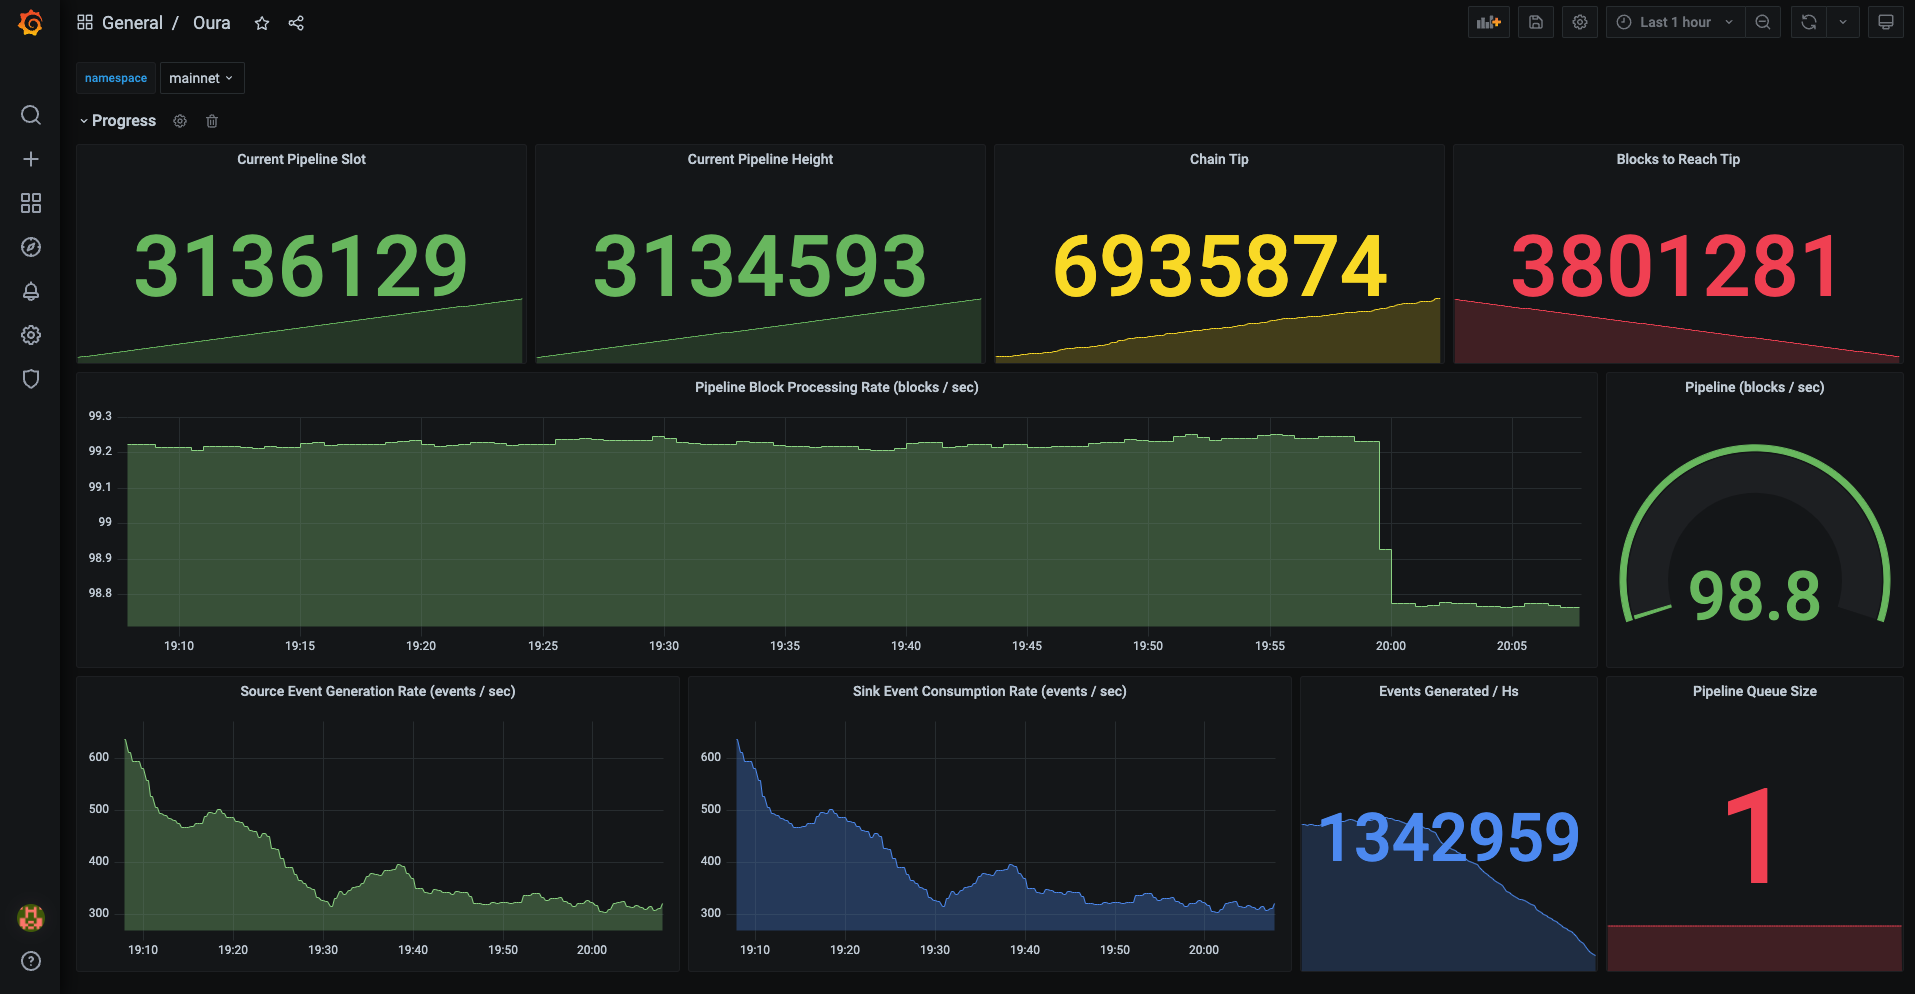
The following screenshot is an example of a Grafana dashboard showing Prometheus data scraped from an Oura instance: